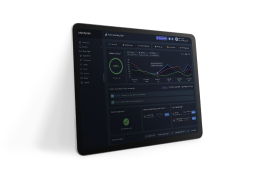
What is Memory Monitoring in Server Monitoring
In the realm of server management, memory monitoring, a critical aspect, deserves our attention. With this functionality, we're able to track real-time memory usage on a server. It's akin to a health check, keeping tabs on the server’s memory performance. It's through memory monitoring that we identify any irregular spikes in memory usage. Such discrepancies could be due to a host of factors such as a memory leak, resource-intensive application, or even a malicious script in action.
How to Implement Memory Monitoring
As we delve further into memory monitoring in server management, let's shift our focus towards its practical implementation. To bolster server performance and prevent unforeseen system crashes, memory monitoring should be implemented seamlessly.
Setting Up Memory Monitoring
To the untrained eye, memory monitoring may seem like a complex process. However, with the right tools at our disposal, it's far from intimidating. Implementing memory monitoring involves setting up notable tools such as MonSpark. Each of these tools offers a distinctive approach towards memory monitoring but all aim to provide a real-time analysis of server memory usage.
At the heart of the setup process is understanding your server's capabilities and needs. These tools provide dashboards to monitor real-time memory usage, charting both historical and current data. Moreover, they often include alerts for sudden spikes in memory usage. These sudden increases could be indicative of memory leaks, overtaxed applications, or other issues that demand immediate attention.
Understandably, every organization's server has unique demands. By understanding these demands, we can modify these memory monitoring tools according to our requirements. Setting thresholds for alerts, defining usage norms, and determining resolution plans are key steps in setting up memory monitoring.
Analyzing Memory Usage Data
After setting up memory monitoring, the next pivotal step is the interpretation of data. An abundance of data is at our disposal, but it's critical to know which parameters to examine. The goal is to diagnose and resolve issues proactively.
Some of the key parameters to look out for are the baseline memory usage, peak memory usage, and the rate at which memory usage is rising. Frequent memory usage spikes could be indicative of an application with high memory demands or a memory leak.
Moreover, these tools also provide metrics to understand how memory is being used. Analyzing these metrics helps in determining whether memory is being wasted or underutilized. For instance, a large amount of cached memory could suggest that the server has more memory than required.
At this juncture, it's necessary to mention MonSpark’s Server Monitoring service. With features that extend beyond just memory monitoring, MonSpark’s offerings are robust, including tracking CPU usage, analyzing disk usage, and monitoring network traffic. This holistic approach towards server health is integral to ensuring seamless server management.
While we've appeared to cover a significant portion of the memory monitoring terrain, the journey in server management is always ongoing. There’s always more to learn, more to implement, and more to optimize. And as we further venture into this realm of technical rigor, the pursuit of server stability continues.
Best Practices for Memory Monitoring
As we delve further into memory monitoring, we arrive at the practical aspect: Best Practices. Let's explore key methods that can help us become more efficient in monitoring server memory.
Regularly Reviewing Memory Metrics
Don't let valuable data points go to waste. Frequent analyses of server memory metrics like baseline and peak memory usage can give us a clear view of current server performance status and potentially project future challenges. MonSpark, with its comprehensive set of monitoring tools, allows us to carry out this regular review process smoother and faster. Performing trend analysis with these metrics aids us in identifying any anomalies, such as memory leaks or overutilization of resources.
Setting Thresholds and Alerts
It's not feasible to manually monitor memory usage 24/7, but setting thresholds and alerts can help us stay on top of things. A right combination of server capabilities and specific requirements can guide us in determining the threshold point for different memory parameters. Alert system of MonSpark makes this even more effortless. When memory usage or other server components cross their respective thresholds, we receive notifications, allowing us to act before a critical event occurs.
Our suggestion to you: deploy a Server Monitoring service from MonSpark. Why? With it at the helm, gain an enhanced view of the server with features like:
- CPU Usage Monitoring: Turns real-time data into meaningful and actionable information, helps identify performance bottlenecks, and optimizes resource allocation.
- Disk Usage Analysis: Monitors disk space utilization, ensuring sufficient storage capacity, and preempts disk space-related issues.
- Memory Consumption Tracking: Detects memory leaks or excessive memory consumption in real-time that could impact server performance and stability.
- Network Traffic Monitoring: Watches incoming and outgoing network traffic for unusual patterns, identifies network bottlenecks, and ensures optimal performance.
As we continue navigating the vast sea of server management, remember: the journey isn't about a one-time setup. It's rather an ongoing process of learning, tweaking, and optimizing practices for increased server stability and performance. From memory monitoring to comprehensive tracking, understanding the basics and implementation can lead us a step closer to seamless server management. But always keep in mind, the journey doesn't end here. In the following sections, we'll dive deeper into the world of server management.
Alerting in Memory Monitoring
MonSpark Server Monitoring includes flexible Alerting Rules to meet all your needs. What are these Alerting Rules?
- Static Threshold: Send me a notification if memory usage exceeds 80%.
- Average Static Threshold: Send me a notification if the average memory usage over the last 5 minutes exceeds 80%.
- Difference Threshold: Send me a notification if the difference in memory usage between the previous 5 minutes and the last 5 minutes exceeds 50 units.
- Percentage Difference Threshold: Send me a notification if the percentage difference in memory usage between the previous 5 minutes and the last 5 minutes exceeds 50%.
This advanced system allows you to define any type of alerting rule, from the simplest to the most complex, and configure it as easily as possible. This way, you can monitor the scenario that best fits your system's behavior.
Conclusion
We've covered the importance of memory monitoring in server management. Regularly reviewing metrics like baseline and peak memory usage is key to assessing server performance and anticipating future challenges. We've seen how setting thresholds and alerts can help us manage memory usage proactively. We've also highlighted the benefits of using MonSpark's Server Monitoring service for greater server visibility. Remember, server management is an ongoing journey of learning and optimizing. With the right tools and practices, we can improve server stability and performance. Keep exploring, keep learning, and keep optimizing.


